You can generate graphs from almost any interactive table data. The following graph types are available (click/tap for more information):
To view the graphing dialog, select Graph Numerical Data from the left menu (desktop mode) or via the hamburger menu (mobile mode) from the interactive table you wish to graph.
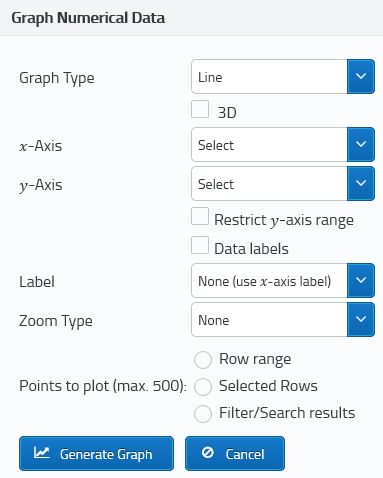
Click here to see the graph dialog
You may plot the following data points:
A maximum of 500 data points can be plotted.
When using a row range to select plot points the graph will be plotted strictly on row number order as shown in the table.
When plotting data using Selected Rows or Filter/Search Results you should first order the interactive table rows as described here. Any ordering applied to the interactive table will be automatically applied to the graph plot points.
Click Generate Graph one you have set the appropriate options.
Hover your mouse or tap data points to see data point information, including any labels that have been applied (selected chart types).
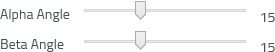
Selected charts can be viewed in 3D. Use the sliders to the bottom left of the chart to change the viewing angle
Selected graph types can be zoomed on the x- or y-axis or both. If you set this option you can click and drag your mouse, or drag your finger on touch enabled devices to zoom the chart on the selected axes. Clcik Reset Zoom on the upper right of the chart to reset to default.
Click the hamburger icon in the top right of the chart to print or save the chart. You may save in the following formats:
If data does not exist for any y-axis plot point then the chart will display no data on the corresponding x-axis point, resulting in gaps on the chart.
If data does not exist for any x-axis plot point then the plot point will be removed from the data entirely. This will be noted in the x-axis data label.