Interactive Tables Overview
Every table in the Handbook web application can be viewed and manipulated
in an interactive mode. This provides the following functionality:
- Sort rows
- Filter rows
- Add or remove columns
- Produce charts from
the data
- Export data
- Easier viewing of
tables on mobile devices
Interactive tables can be accessed
by the following methods:
- Select the interactive
table from the drop-down list at the top of the document, below the
Additional Information button.
- Clicking the link above
the table in the document, labelled 'Go to interactive table' (desktop
mode) and 'Mobile-friendly table' (mobile mode)
- From search results prefixed
with the table icon

The left menu (desktop mode) and hamburger menu (mobile mode) contain
the various tools for manipulating tables, creating charts and exporting
data:
 Back to search
 View Full Document.
 Filter and sort the table
 Hide/Show Columns
 Footnotes. If the table has footnotes you can view them here.
 Export data to csv, xls or html
 Produce a variety of graphs and charts based on
table data
Produce a variety of graphs and charts based on
table data
 View the full table and reset to defaults
Use the tools above and below the table to navigate and set the number
of rows per page.
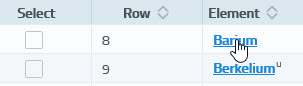
Chemical Entries
In selected tables that contain chemical compounds it is possible to
click the chemical name (highlighted in blue) to view extended information
about the compound.
These data are gathered from the chemistry
section of the Handbook, which contains physical property data and
searchable structure found in every table in which the compound is present.
You can therefore view far more information than is present in the
current interactive table you are viewing.
If a chemical name is highlighted in blue, simply click/tap it to view
the entry dialog.
Click here
to see more information on the chemical entry.